Features
Observation Deck is a three application toolkit for capturing set up, capturing observations, and exploring data.
Observer Features
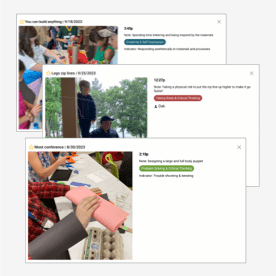
Observations are recorded sequentially showing the full arc of the process or experience.
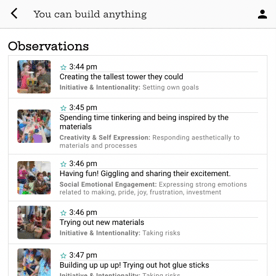
Pictures capture 1000 words. Capture collaboration, pride, joy, and connection through visual media to tell your story.
Attach a quick note, quote, or realization to your media for in depth storytelling later.
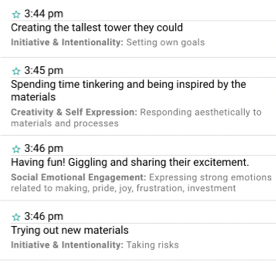
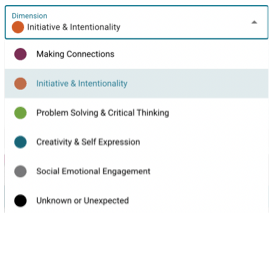
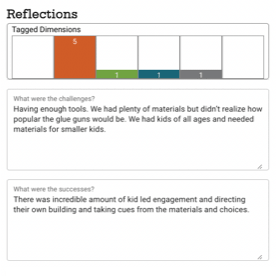
You know why you captured that moment! Tag it with your predetermined indicators of learning outcomes.
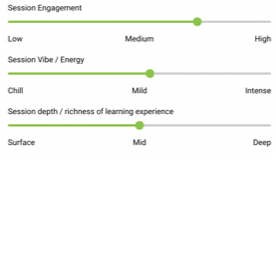
Get to the squishy stuff! How did the session feels with levels of engagement, depths of learning.
Use a quick talk to text function to record the successes, challenges, and plans for the future.
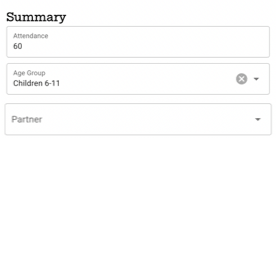
Add your community partners, locations, attendance numbers, and age groupings to session to build the whole story of your service.
Reporter Features
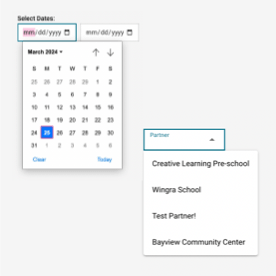
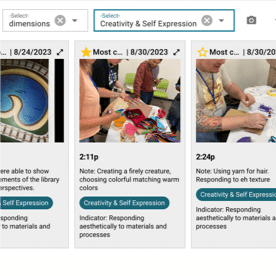
Filter sessions by date, age, location, partner, and facilitator.
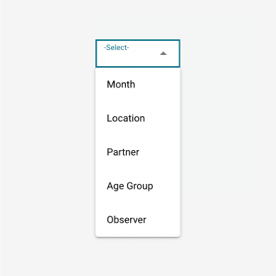
Focus on a program series, a time span, a grant project, or a community partner to find the stories of success and challenges to explore for the future.
See at a glance which programs are serving which outcomes - See every observation tagged as “creativity and self expression.”
Attach real quotes, notes, and images to those outcomes. Let your successes come to life for your stakeholders.
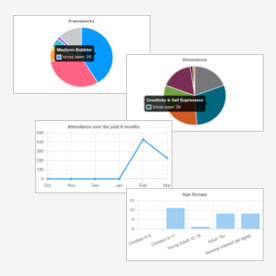
Turn your data into helpful visuals of outcome tags, age groups served, or the range of program “vibes.”
Administrator Features
Create different user types with varying abilities such as observer and institutional managers.
Choose from one of our out-of-the-box frameworks created by Madison Public Library, Waupaca Public Library or Skokie Public Library.
Create a custom framework tied to your library's strategic priorities.